 Inference
 Marketplace


Introduction
The ZEDEDA console is organized into three service areas: Infrastructure, Inference, and Marketplace. Each area has its own sidebar navigation and context controls. This article explains the layout of the console so you can find the pages and tools you need.Prerequisites
- A ZEDEDA account with access to at least one service area.
- A supported web browser.
Console at a Glance
This example shows Infrastructure > Fleet > Nodes, with the sidebar expanded and four table columns selected. The labels identify the same areas you will use throughout the console.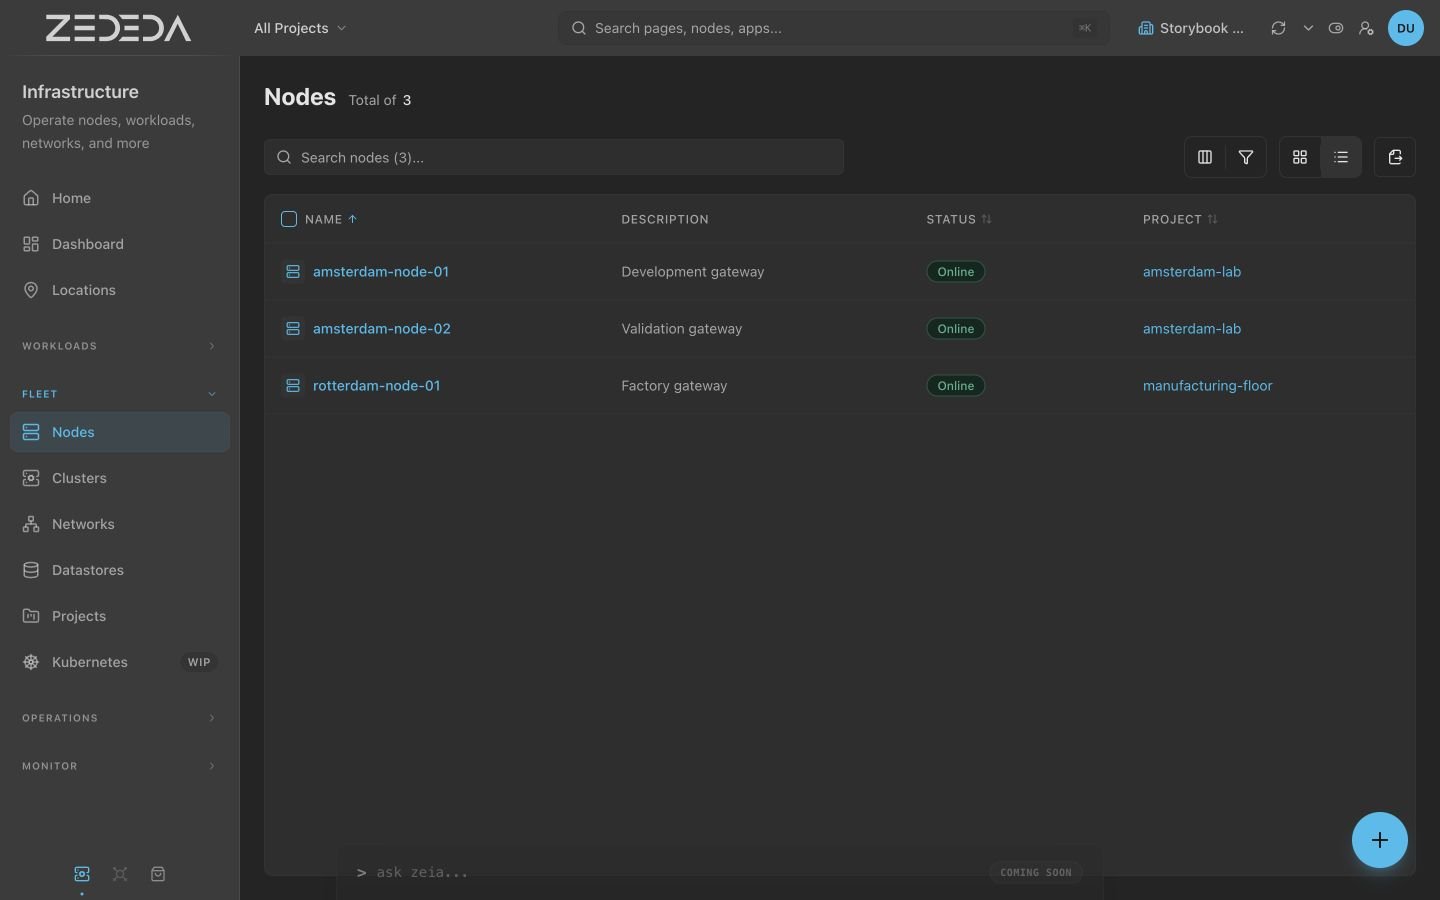
Example with sample data. Select a label to learn about that part of the console. Controls vary by service area, role, and entitlement.
Service Areas
Use the service-area buttons at the bottom of the sidebar to change areas. Only services available to your account can be opened.Infrastructure Services
Nodes, workloads, delivery, monitoring, administration, and Kubernetes operations.

Edge Inference Services
Models, providers, evaluation, deployment, and validation.

Marketplace
Cross-service catalog, library, publishing, Edge Apps, Kubernetes apps, AI Apps, Models, and Hardware.
Header Controls
The header stays available as you move between pages. These close-ups show the Infrastructure header; the numbers match the reference below.
1 · Project selector 2 · Global search

3 · Enterprise 4 · Refresh 5 · Legacy UI 6 · Users and roles 7 · Profile
Data freshness and auto-refresh
Data freshness and auto-refresh
Hover over the refresh icon to see how old the data is, how many data sources returned data, and whether any failed. An amber dot warns that the data may be out of date.Select the adjacent chevron to choose Off, Every 2 minutes, Every 5 minutes, or Every 10 minutes. Auto-refresh is off by default. Your selection is saved to your account and applies in any browser you sign in from. The out-of-date warning does not appear while auto-refresh is on.
Sidebar Navigation
The sidebar is the primary way to move between service areas and their major workflows. It is expandable: hover over the right edge of the sidebar until you see the> arrow, then click it to expand. Click < to collapse it again.
The sidebar opens in collapsed mode by default. Keep it expanded until you are familiar with the icons for each section.
The Infrastructure sidebar includes the following sections: Dashboard, Locations, Workloads, Fleet, Operations, and Monitor. Workloads > Build includes App Images, Binary Artifacts, Patch Envelopes, and Secrets.
The Inference sidebar has its own Build, Deploy, and Monitor groups.
The Marketplace sidebar provides Browse and Library experiences across both services.
Shared console pages
Locations appears in both the Infrastructure and Inference sidebars. It reflects your fleet-wide node distribution and is not specific to either service area.- Locations shows the geographic distribution of your nodes and deployments on a map. See Locations.
- Dashboard is not a shared page. Infrastructure has its own Dashboard at Infrastructure > Dashboard, and Inference has its own Inference Dashboard at Inference > Dashboard. Each dashboard shows metrics specific to its service area.
Common Page Shape
Most pages in the console share the same structure:- Page title and optional object count.
- Primary action buttons in the page header.
- Table, card, or detail content.
- Filters, search, sorting, and row actions where the object type supports them.
- Detail pages with breadcrumbs, metadata, status, and action buttons.
Action Icon Reference
Use this reference to recognize common controls. Hover over an icon in the console to see its label. The available actions depend on the page and your permissions.
1 · Columns 2 · Filters 3 · View 4 · Export
The search and table guide and export guide include screenshots and optional animations showing these controls in use.
Changes From the Previous Console
Find a familiar name below, then follow its path in the new console. Paths include sidebar groups, page tabs, and header menus. Availability depends on your enterprise and enabled services.Items renamed and relocated
From Edge Infrastructure Services
Previously: Edge Nodes
Now: NodesLocation: Infrastructure > Fleet > Nodes
Previously: Edge Node Clusters
Now: ClustersLocation: Infrastructure > Fleet > Clusters
Previously: Edge App Instances
Now: ApplicationsLocation: Infrastructure > Workloads > Applications
Previously: Edge KubernetesClusters
Now: Clusters / KubernetesDepends on your enterpriseLocation: Infrastructure > Fleet > ClustersSome enterprises use the separate Kubernetes view:Location: Infrastructure > Fleet > Kubernetes
Previously: Edge KubernetesKubernetes Marketplace
Now: KubernetesHidden in menuLocation: Marketplace > Browse > KubernetesThe Kubernetes Marketplace entry is currently hidden. It appears here when the feature is enabled.
Previously: LibraryNetwork Instances
Now: Virtual NetworksLocation: Infrastructure > Workloads > Virtual Networks
Previously: LibraryData Stores
Now: DatastoresLocation: Infrastructure > Fleet > Datastores
Previously: LibraryPatch Envelopes
Now: Patch EnvelopesLocation: Infrastructure > Workloads > Build > Patch Envelopes
Previously: LibraryEdge App Images
Now: App ImagesLocation: Infrastructure > Workloads > Build > App Images
Previously: LibraryBinary Artifacts
Now: Binary ArtifactsLocation: Infrastructure > Workloads > Build > Binary Artifacts
Previously: LibraryVolume Instances
Now: VolumesLocation: Infrastructure > Workloads > Volumes
Previously: MarketplaceModels
Now: HardwareLocation: Marketplace > Browse > HardwareFor imported or custom hardware models:Location: Marketplace > My Library > Hardware
Previously: AdministrationProjects
Now: ProjectsLocation: Infrastructure > Fleet > Projects
Previously: Enterprise
Now: Enterprise SettingsLocation: Header > Profile avatar > Enterprise Settings
From Edge Inference Services
Previously: Model Hub
Now: ModelsLocation: Inference > Deploy > Models
Previously: Sources
Now: ProvidersLocation: Inference > Deploy > Providers
Previously: Benchmarks
Now: EvaluationLocation: Inference > Deploy > Evaluation > Benchmarks
Previously: Agents
Now: AI AppsLocation: Marketplace > Browse > AI Apps
Items relocated but not renamed
From Edge Infrastructure Services
Item: Networks
Location: Infrastructure > Fleet > Networks
Item: Reports
Location: Infrastructure > Monitor > Reports
Item: Jobs
Location: Infrastructure > Operations > Jobs
Item: Edge Apps
Location: Marketplace > Browse > Edge AppsFor imported or custom apps:Location: Marketplace > My Library > Edge Apps
From Edge Inference Services
Item: Device Pools
Location: Inference > Deploy > Evaluation > Device Pools
Item: Deployments
Location: Inference > Deploy > Deployments
Item: Jobs
Location: Inference > Monitor > Jobs
Item: Organizations
Location: Inference > Header > Users and roles > Organizations
Item: Users
Location: Inference > Header > Users and roles > Users
Item: Roles
Location: Inference > Header > Users and roles > Roles
Next Steps
Sign In and Switch Context
Access your account and switch between enterprises or projects.
Search, Tables, Filters, and Actions
Use search, filters, and bulk actions across console list views.
Permissions and Visibility
Understand how roles control access and what users can see.